How NewYork Cables cut ACoS 35% and grew sales 38% in one month
A verified Amazon PPC restructure of 263 Sponsored Products campaigns, with no increase in ad spend. July to August 2024.
Client: NewYork Cables · Electronics and cables · July to August 2024
Sales growth
ACoS reduction
More orders
Less ad spend
Background
The story
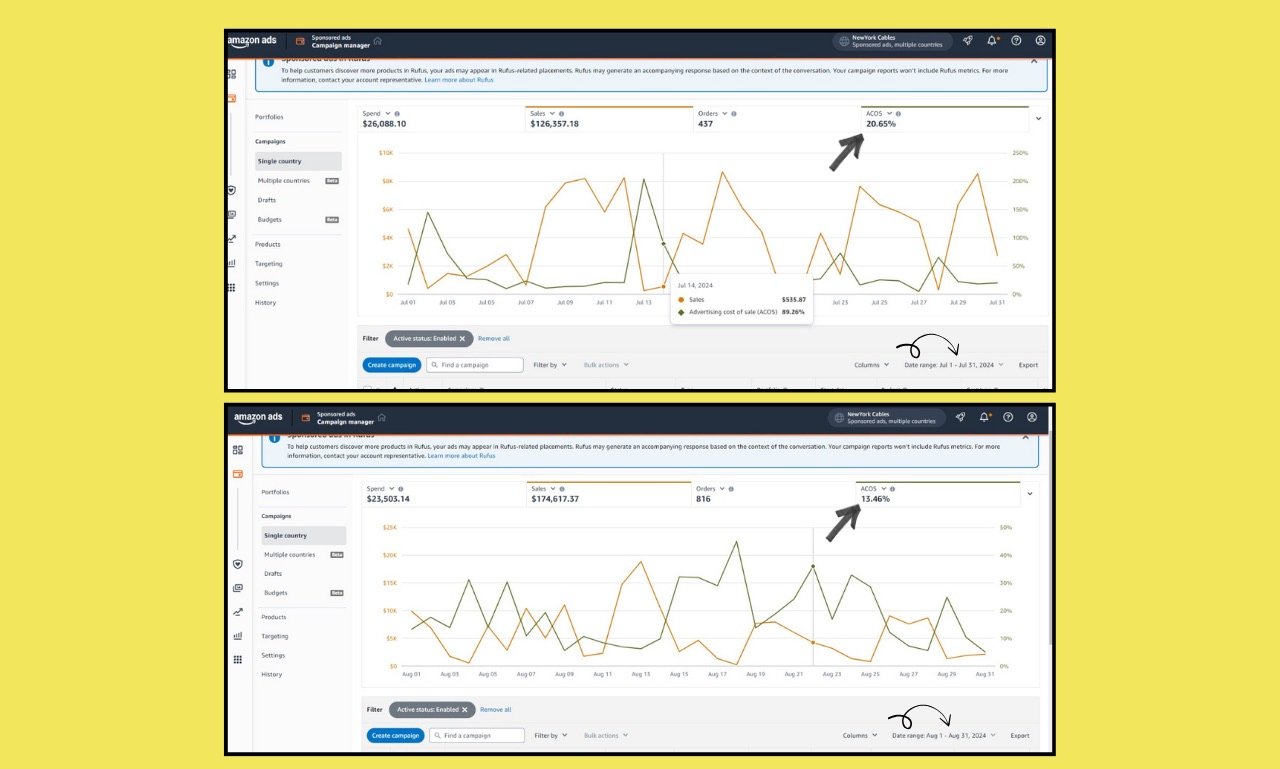
NewYork Cables sells cable and electronics accessories on Amazon across multiple marketplaces. With 263 active Sponsored Products campaigns, the brand had healthy traffic but inefficient ad spend. By July 2024, ACoS had climbed to 20.65%, eating into margin despite strong sales. The team needed a structured PPC partner to fix the foundation before scaling spend.
"263 campaigns. One month. Zero added budget."
The challenge
- All 263 campaigns ran in a mixed, unorganized way: Auto, Manual Exact, Broad and Phrase all overlapping.
- Budget cannibalization: campaigns bidding against each other for the same keywords.
- Wasted spend: irrelevant search terms triggering ads with no conversions.
- No portfolio structure, almost no negative keyword strategy, and no daily pattern analysis.
What we did
A 5-step restructure
Rebuilt 263 campaigns
Isolated branded, competitor and generic keywords into 4 dedicated portfolios.
Negative keyword sculpting
Campaign-level and ad-group-level negatives to block irrelevant traffic.
Search term harvesting
Promoted high-converting terms from Auto to Exact Match and added them as negatives in Auto.
Placement-based bidding
Boosted Top-of-Search multipliers and reduced Rest-of-Search and Product Page bids.
Weekly heat map analysis
Found Friday peaks, boosted budgets Thursday night and scaled back Sunday and Monday.
The results
30 days, 263 campaigns, verified
Full month-over-month breakdown from Amazon Ads Campaign Manager.
| Metric | July | August | Change |
|---|---|---|---|
| Ad spend | $26,088.10 | $23,503.14 | -$2,585 (-10%) |
| Total sales | $126,537.78 | $174,617.37 | +$48,080 (+38%) |
| Total orders | 437 | 816 | +379 (+87%) |
| ACoS | 20.65% | 13.46% | -7.19pp (-35%) |
| Revenue per $1 | $4.85 | $7.43 | +$2.58 (+53%) |
| Daily avg sales | $4,082 | $5,633 | +38% |
| Campaign status | 263 mixed | 263 isolated | Restructured |
Want results like these?
Book a free Amazon PPC audit. No pitch, just a real look at where your account is leaking spend.
Free account audit · No obligation
Or email hello@sellercue.com